Custom Report
Suppose you want to create a report with all fields from the Customer List table except Customer Number. You would also like the report to be grouped by city, sorted by last name, and have summary statistics for the Amount and Paid columns. Access's Report Wizard is the answer to this complicated task.
In the Reports tab, click the New button, Report wizard, choose the Customer List table from the list. OK.
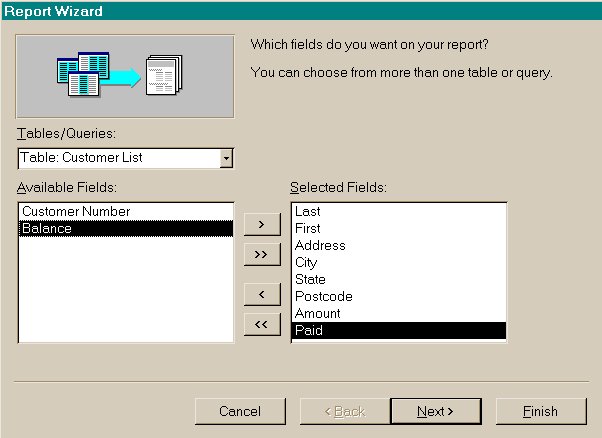
The Repot Wizard appears. Its first dialog box is used to select the fields that you want to include in the report.
Click the Last field in the Available Fields box and then the > button
Click the First field in the Available Fields box and then the> button
Repeating the above steps, select the Address, City, State, Postcode, Amount and Paid fields. You can also double-click each desired field in the Available Fields box to select them.
Note that clicking the >> button selects all fields. Clicking the < button deselects a single field, and clicking << button deselects all fields.

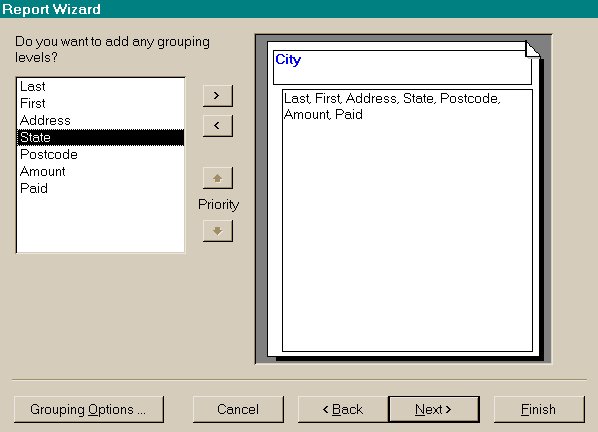 The next dialog box is where you will group all customers by the City field. Click City in the list box and then click the > button. Click the Next button. Your window should resemble the figure at the beginning of the paragraph.
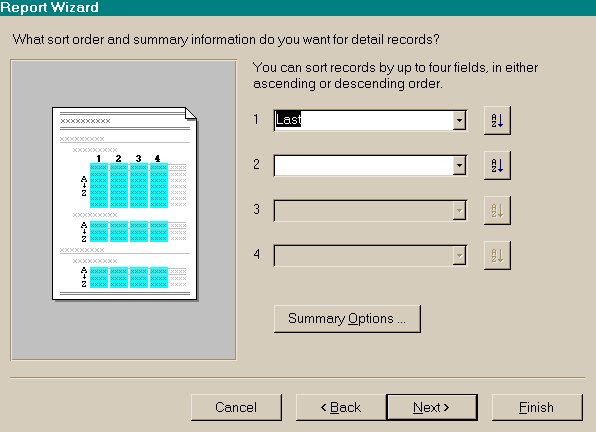 This dialog box is for setting sorting order and placing summary statistics in your report. Click the down arrow of the number 1 drop down box, and then click Last to sort by this field.
You can sort to upto four levels. Each level can also be sorted in ascending or descending order. Use the Sort button to the right of the sort level box to define the order.
Now to add summary statistics to the Amount and Paid columns:
Click the Summary Options to display its dialog box
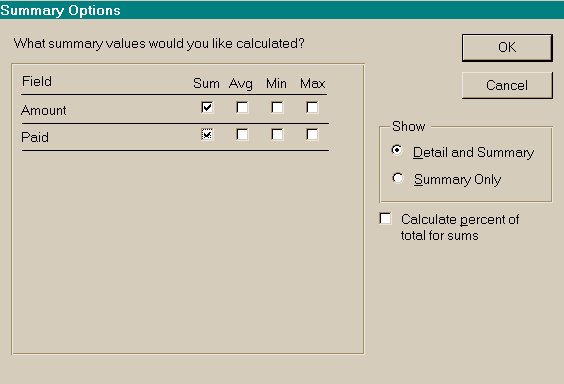
Click the Sum check box for the Amount field
Click the Sum check box for the Paid field
This dialog box also lets you set the report to show "Detail and Summary" or "Summary Only" in the report and a percentage of the total for sums.
Click OK to return to the previous dialog box, and then click the Next button.
This dialog box lets you set the layout of your report. By default the report layout is set to Portrait. Click on the Landscape option. Click the Next button for the Style selection dialog box.
By default the dialog box is set to Corporate style. You can select another style by clicking on any other option in the list provided, and view the style change in the window next to it. When having picked the option, click Next.
This dialog box lets you name the report, and is the last dialog box of the Wizard. Type in Customer by City Report in the title box. You can also specify the way you will first see the report (Print Preview or Design View)
To create the report and display it in Print Preview, click on the Finish button.
Click the maximize button of the Print Preview window. Use the window's scroll bars to view its content.
As you scroll to the Paid and Grand Total fields, you will note that they are partially displayed.
To correct the display in the Print Preview and ultimately how it looks you will need to go into the design view. Click on the set square icon.
Modifying a Report's Design
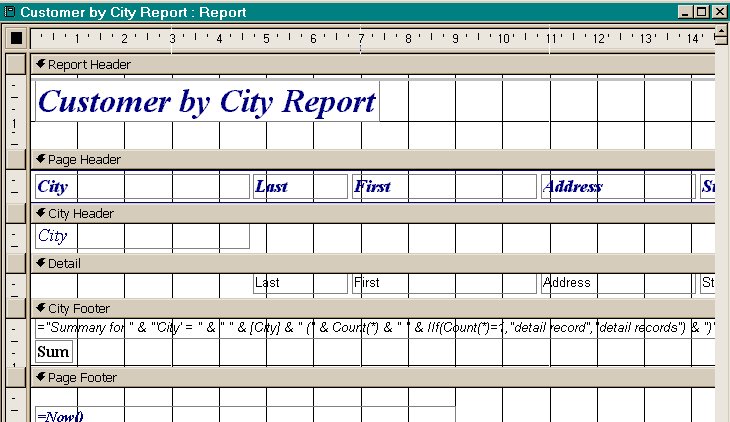 You will note that the report's structure is divided into bands: Report Header, Page Header, City Header, Detail, City Footer, Page Footer, and Report Footer. A band is a separate section of a report. The line at the top of each band identifies and separates the band and is referred to as the band's title line. To select a band, click its title line to highlight it. The selected band is the one, which you are currently working.
The table below describes the band in the standard definitions:
|
Band |
Description |
|
Report Header band & Report Footer band |
Form the top and bottom base layers of the report. Items in these bands print only once in the entire report. Items placed in the report header appear at the start of the report; items placed in the report footer appear at the end of the report. |
|
Page Header band & Page Footer band |
Print once on each page. Items placed in the page header appear at the top of each page; items placed in the page footer appear at the bottom of each page. |
|
Detail band |
Forms the body of the report. When a report is created, this band is filled with data from the table associated with the report. |
|
Group band |
An optional band created when records are grouped within the report. Group identification is typically placed at the top of the band; summary statistics are placed at the bottom |
 All graphical objects with a band are called controls. A control includes text boxes, list boxes, check boxes, option buttons, command buttons, lines, and rectangles. . A calculated control displays the result of a mathematical equation, for example a summary statistic. The icon on the toolbar, which has an image of a hammer and a spanner, activates the controls. When the mouse pointer is placed on the icon it identifies it by the name Toolbox.

To resize label, field, and calculated objects, you first select them and then drag one of their selection handles (small square boxes) that are located along each object's border.
Objects can also be sized to fit their data, to a grid, and to the tallest, shortest, widest, and narrowest data. The size submenu of the Format menu offers these options, which you will find useful.
You can also add a field to a report's design by using the Field List dialog box. Click on View (Menu bar), Field List. You can pick the field you want from the table.
You can begin changing the layout of the report by following some of the pointers from above.
Once you are satisfied with the look of the report, you can save the final effort.
When you are in the object window, and the Reports tab is open, click on New, and choose Label Wizard, Customer List, and OK.
Follow the instructions on the dialog boxes, experiment with the different options available, i.e. label sizes, etc. Acquaint yourself with the Label Wizard. This acquaintance will come in handy later.
|
Top of the Page |
To previous page |
To main page |